Project Summary & Skills Used
Our project focuses on realigning all 134 FBS (Football Bowl Subdivision) college football teams using an optimization model designed to minimize total geographic travel distance while maintaining a reasonable level of competitive balance. The current conference structure leads to excessive long-distance travel and significant inefficiencies; our model aims to propose a data-driven alternative.
To build this system, we collected three major data sets:
1. Team performance rankings across multiple years
2. Geographic coordinates for all FBS programs
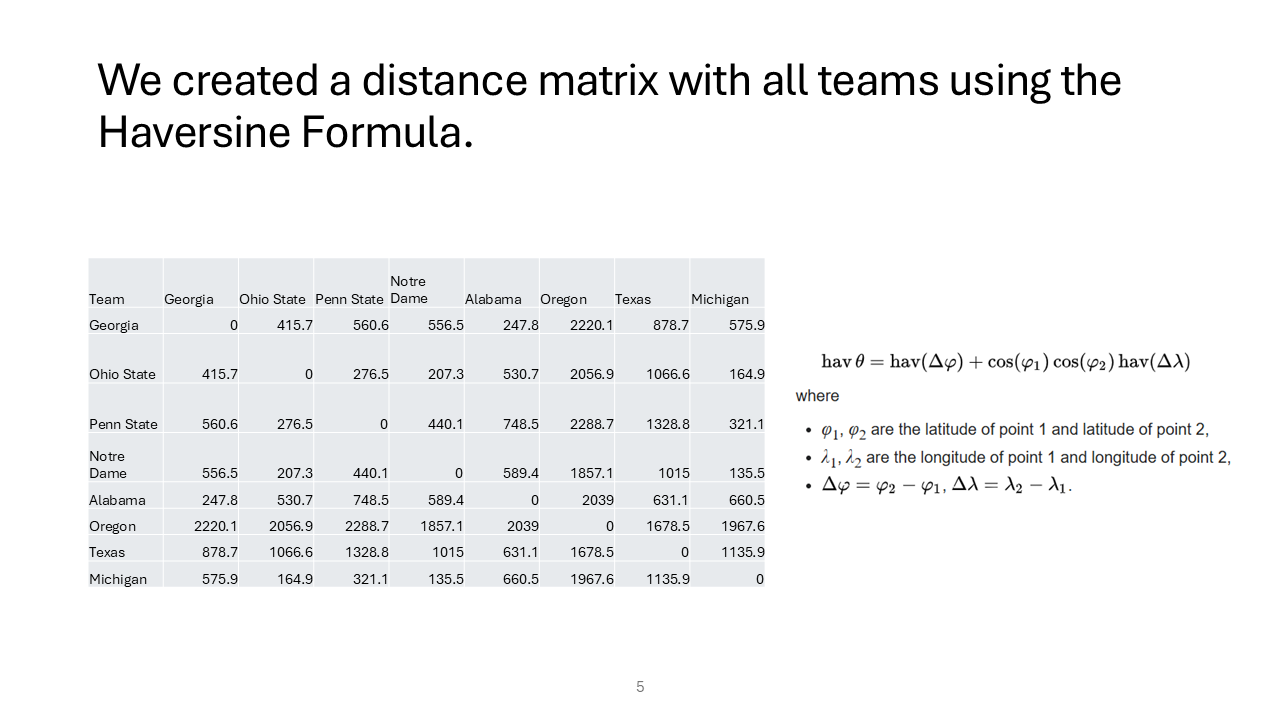
3. A complete pairwise distance matrix based on the Haversine Formula
These data sets enabled us to quantify both competitive strength and geographic proximity.
From an Industrial Engineering perspective, this project applies core operations research concepts including binary decision variables, constrained optimization, objective function design, logical linking constraints, and large-scale data processing. The work reflects a real-world application of OR modeling to a system with significant logistical complexity.
Skills Used
- Mathematical modeling and optimization formulation
- Data cleaning and parameter generation (rankings, coordinates, distance matrix)
- Use of the Haversine Formula for geographic distance calculations
- Excel-based large-scale computation
- Debugging model feasibility and evaluating solver limitations
- Interpreting optimization results and model structure
Project Development Process
Initial Idea
The original vision for our project was to build a fully integrated optimization model that realigns every FBS team into conferences that minimize travel distance and maintain competitive balance. To achieve this, we planned to incorporate multi-year average rankings into the objective function while also enforcing geographic proximity.
Evolution of the Design
As we progressed, we discovered that including ranking-based penalties drastically increased the model’s computational complexity. Even after multiple attempts and long solver runtimes, the model struggled to converge when both ranking and distance were included. Because our primary research goal centered on geographic travel reduction, we pivoted to a distance-only model which allowed for efficient and meaningful results.
Throughout this evolution, we also refined how we structured our data, validated our ranking sources, and built a reliable 134×134 distance matrix. We went through multiple iterations of cleaning, formatting, and linking our inputs to the optimization formulation.
Challenges and How We Solved Them
Computational difficulty
Adding ranking metrics significantly increased the problem size and made solving infeasible with our available tools. We resolved this by focusing solely on minimizing geographic distance.Data collection
We manually researched the city, latitude, and longitude for all 134 teams — a time-consuming but necessary step to ensure accurate geographic modeling.Distance matrix construction
Building a full distance matrix required applying the Haversine Formula in Excel across all team pairings, resulting in a 134×134 matrix of distances.Logical constraints
Ensuring the linking between ( x_{ic} ) and ( y_{ijc} ) behaved correctly took multiple debugging cycles and careful checking of constraint logic.
Expectations vs. Results
We expected the model to run with both distance and ranking included, but solver limitations forced us to adapt. Despite this, the distance-only model produced realistic conference assignments and demonstrated substantial reductions in travel requirements. If given stronger computational tools, we believe the combined model could yield even more meaningful realignments that better balance geography and competitive strength.
Key Features or Highlights
1. Optimization Model Structure
Our optimization model uses two sets of binary decision variables:
- ( x_{ic} = 1 ) if team ( i ) is assigned to conference ( c )
- ( y_{ijc} = 1 ) if teams ( i ) and ( j ) are both assigned to conference ( c )
The primary parameter is:
- ( d_{ij} ): the Haversine-based distance (in miles) between teams ( i ) and ( j )
Objective
The objective is to minimize the total in-conference travel burden by summing all pairwise distances for teams placed together in the same conference.
Key Constraints
- Each team must be assigned to exactly one conference
- Each conference can have at most 17 teams
- Logical linking constraints ensure ( y_{ijc} ) can only be 1 if both ( x_{ic} ) and ( x_{jc} ) are 1
These elements combine to form a large-scale, binary optimization model that mirrors the structure of real-world realignment decisions but grounds them in quantitative logic.
2. Data Pipeline and Parameter Creation
To approximate competitive strength, we gathered ranking data from multiple sources for three seasons (2022–2024). For each team:
- We extracted its ranking for each year
- We computed the average ranking across the three years
- This average ranking was designed to serve as a parameter to help balance conferences competitively
For the geographic portion:
- We identified the city associated with each FBS team
- We collected the latitude and longitude for each city
- Using the Haversine Formula, we computed the full distance matrix of all team pairs
This pipeline produced the parameters necessary to populate the model, especially the ( d_{ij} ) matrix that drives the distance-based objective.
3. Visual Motivation: Current FBS Landscape
This slide introduces the motivation and goal of the project: using operations research to propose a realignment that reduces overall travel.
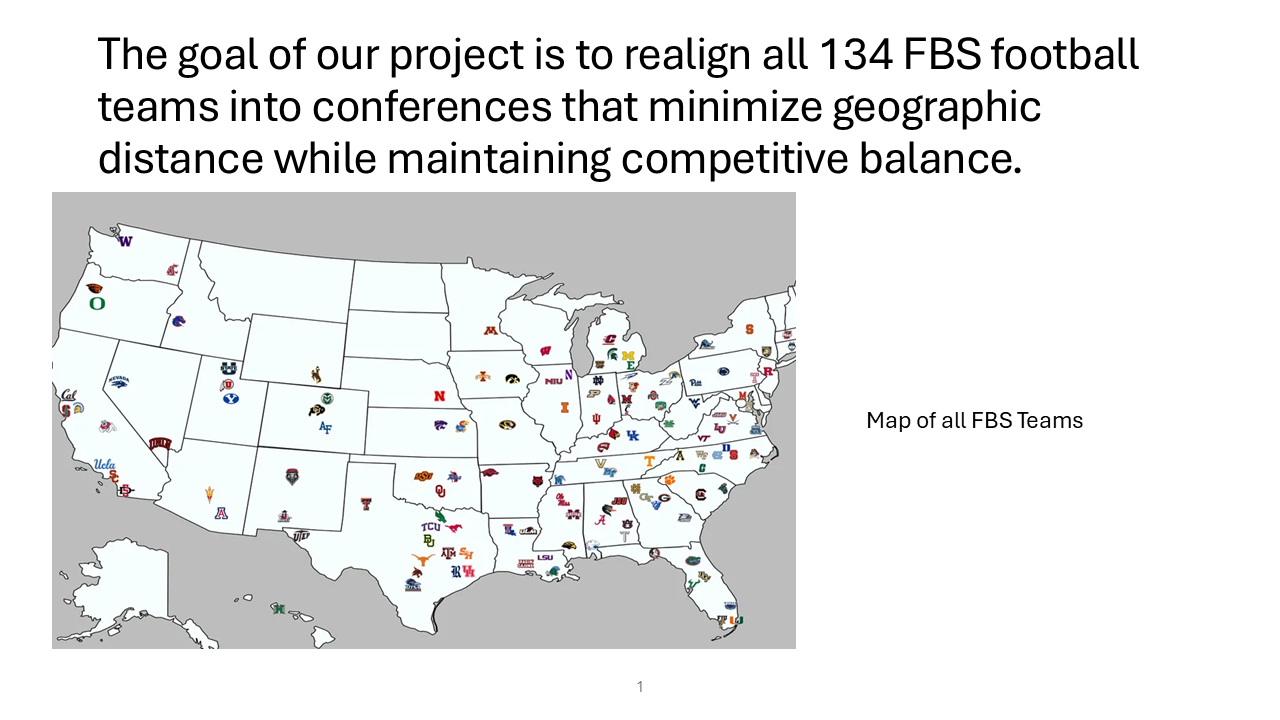
This map highlights how widely scattered the current FBS teams are across the country. It visually reinforces the intuition that current conferences create long and inefficient travel patterns.
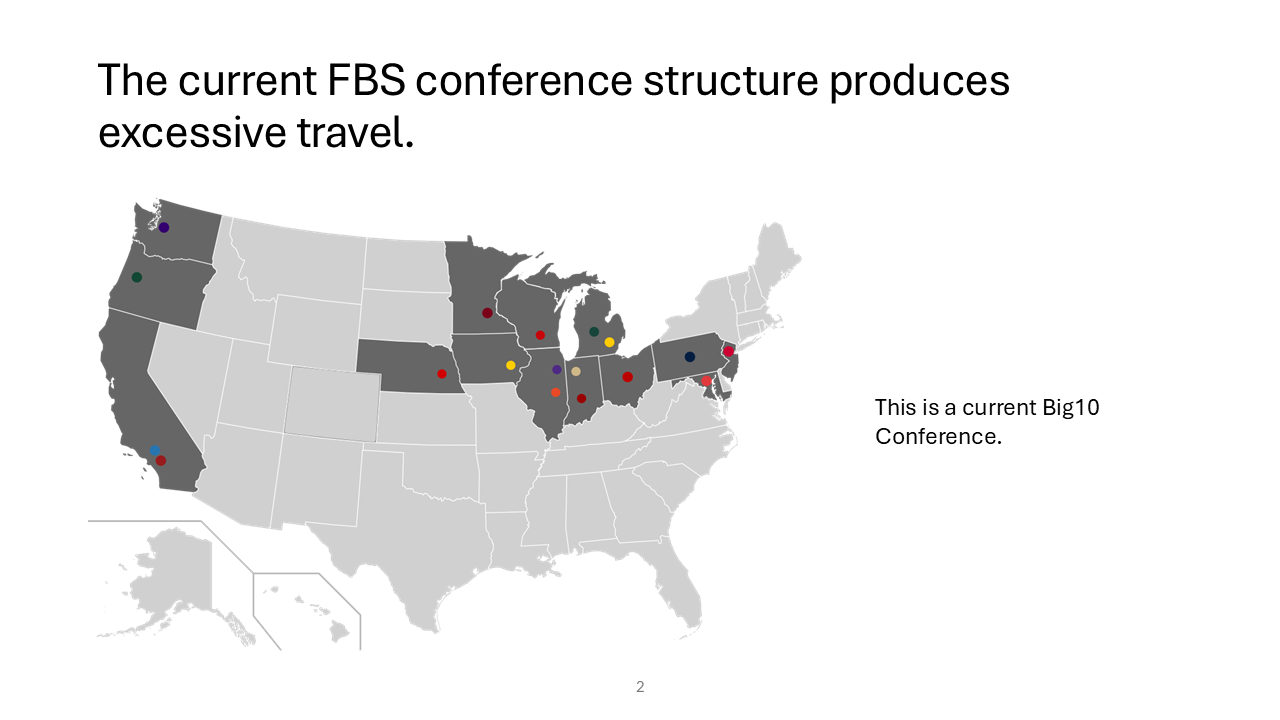
This slide zooms into a specific example—the Big Ten—showing how geographically stretched a single conference can be under the current alignment. It provides a concrete case that motivates our distance-minimization approach.
4. Model Formulation and Data Example
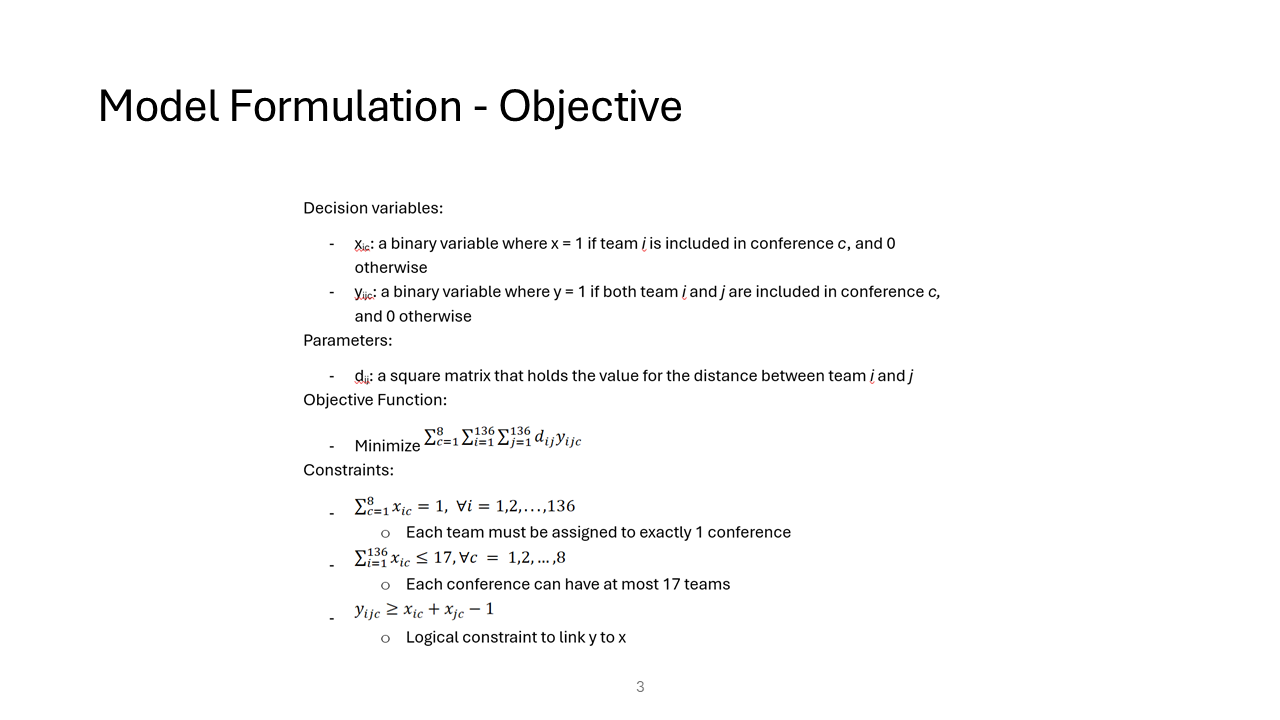
This slide summarizes the model formulation, including the definition of decision variables, key parameters, and the high-level structure of the objective and constraints.
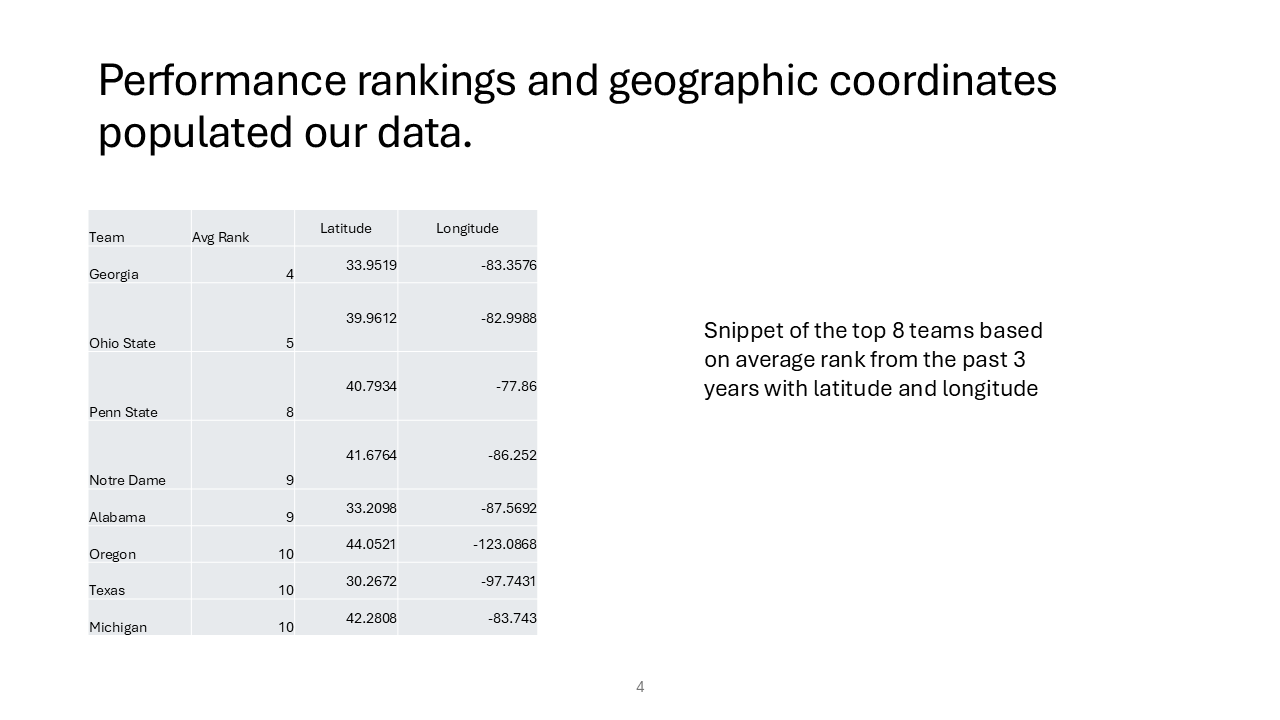
Here we show a small portion of the dataset: top teams with their average ranking over three years and their geographic coordinates. This illustrates how performance and location come together to define the model inputs.
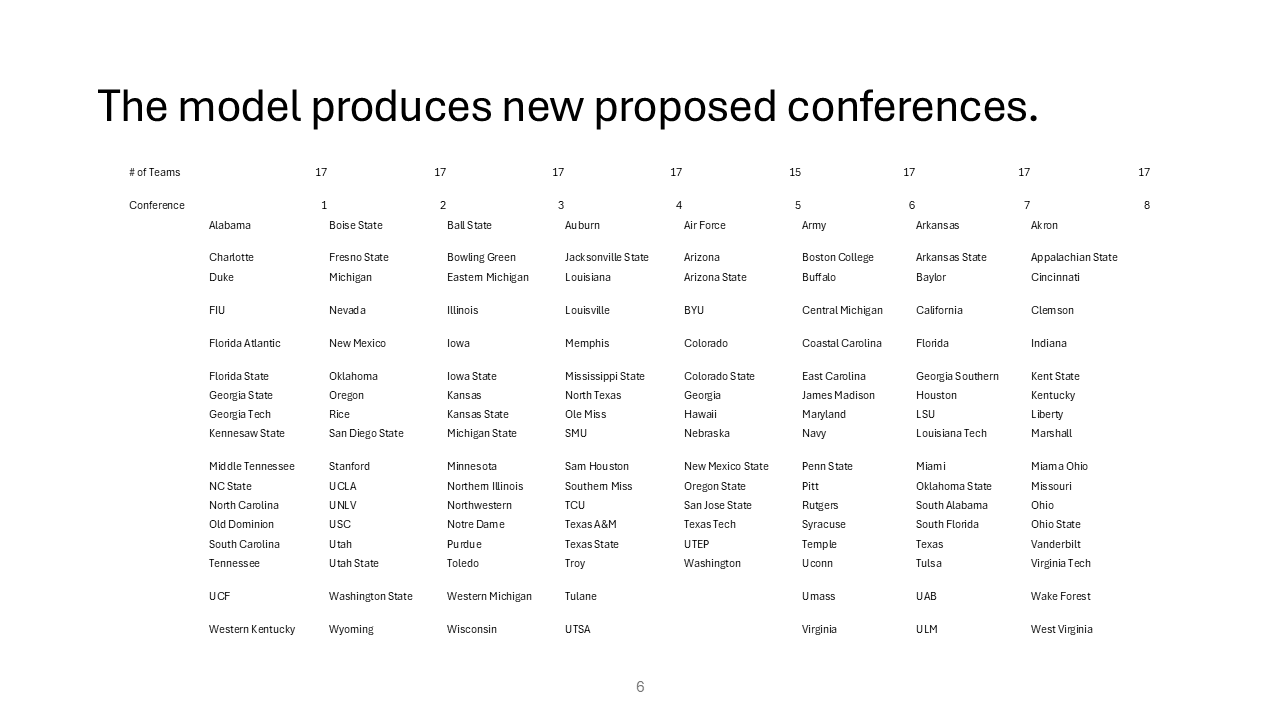
5. Optimized Conferences and Takeaways
This slide presents a sample of the new conferences produced by the model. The groupings are more geographically compact than many of the current conference structures, reducing travel distances for most teams.
The final slide summarizes our main findings:
- Our solution reduces total travel distance for many teams
- A data-driven, OR-based approach can remove some of the politics and bias from realignment decisions
- Incorporating ranking would create richer competitive balance but demands stronger computational resources
- A nationwide structural change of this kind would likely require a rethinking of the playoff system
These highlights capture how our work combines data, modeling, and practical insight.
Reflection
This project strengthened my understanding of how operations research can be used to analyze large, complex real-world systems. Translating the entire FBS landscape into mathematical variables, constraints, and parameters showed me how OR tools bridge the gap between intuition and quantitative decision-making.
What I Learned
I learned how to:
- Build and interpret a binary optimization model from a real problem description
- Manage large datasets and prepare them for use in a mathematical model
- Implement and apply the Haversine Formula to compute geographic distances
- Debug feasibility issues and evolve a model when computational limits arise
- Recognize when simplifying assumptions (such as focusing only on distance) are necessary given tool limitations
My Contributions
I contributed to:
- Collecting and formatting multiple years of FBS ranking data
- Manually researching and validating the coordinates for all 134 teams
- Constructing the distance matrix used for the ( d_{ij} ) parameter
- Debugging and testing the optimization model and its constraints
- Inpereting the results and how they could improve
- Helping to design and refine the presentation slides, including maps and data summaries
Personal Growth
At the start of this project, I was less confident in building complete OR models from scratch, handling large datasets, and using geographic computation in a meaningful way. By the end, I had gained practical experience in each of these areas and developed a stronger problem-solving mindset.
I now feel more capable in:
- Formulating and interpreting optimization models
- Structuring data and parameters for large-scale problems
- Understanding how computational power and model design interact
- Communicating technical results through clear visuals and written explanation
Overall, this project gave me a concrete example of how operations research can be applied beyond the classroom, and it has made me more confident in my ability to tackle similar modeling challenges in the future.